Department of Civil Engineering, Indian Institute of Science Bangalore
Multichannel Analysis of Surface Wave (MASW) Survey
Site characterization by evaluating velocity parameters at a shallow level is significant to establish the earthquake shaking on the ground surface. Shear wave velocity is an essential parameter for evaluating the dynamic properties of soil in the shallow subsurface. MASW is one of the most widely used techniques in geotechnical engineering for the measurement of shear wave velocity, dynamic properties, identification of subsurface material boundaries and spatial variations of shear wave velocity. About 58 one-dimensional (1-D) MASW surveys and 20 two-dimensional (2-D) MASW surveys have been carried out. The test locations are selected in such a way that these represent the entire city subsurface information. In about 38 locations MASW survey points are very close to the available SPT borehole locations and these are used to generate correlation between shear wave velocity and corrected SPT N values
MASW testing locations in Bangalore city
MASW is a geophysical method, which generates a shear-wave velocity (Vs) profile (i.e., Vs versus depth) by analyzing Raleigh-type surface waves on a multichannel record. The captured Rayleigh wave is further analyzed using SurfSeis software. MASW has been effectively used with highest signal-to-noise ratio (S/N) of surface waves. The optimum field parameters such as source to first and last receiver, receiver spacing and spread length of survey lines are selected in such a way that required depth of information can be obtained.
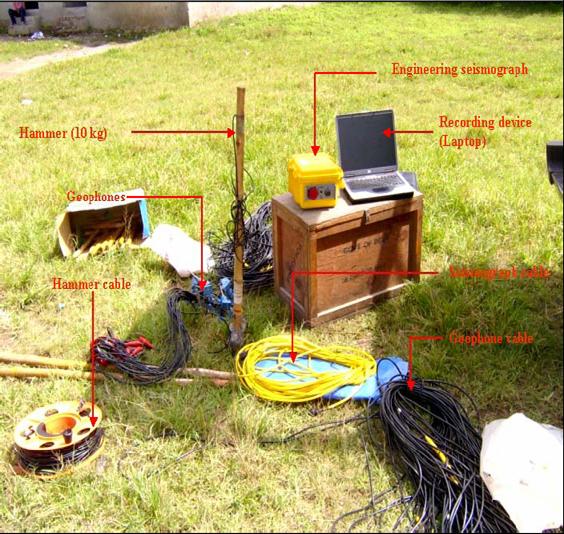
MASW instrument with components (modified after Mahajan,2007)
The generation of a dispersion curve is a critical step in MASW method. A dispersion curve is generally displayed as a function of phase velocity versus frequency. Phase velocity can be calculated from the linear slope of each component on the swept-frequency record. The lowest analyzable frequency in this dispersion curve is around 4 Hz and highest frequency of 75Hz has been considered. The dispersion curve obtained for the locations has a very high signal to noise ratio of 80 and above.
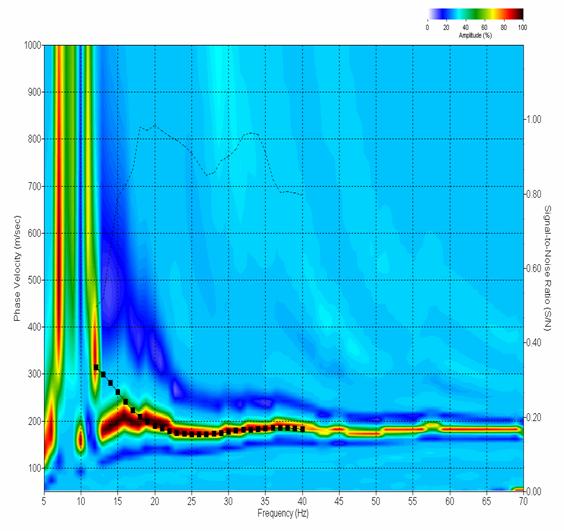
Typical dispersion curve obtained from MASW
The seismic site characterization for calculating seismic hazard is usually carried out based on the near-surface shear wave velocity values. The average shear wave velocity for the depth d of soil is referred as VH is computed as follows:

 = cumulative depth in m
For 30m average depth, shear wave velocity is written as:

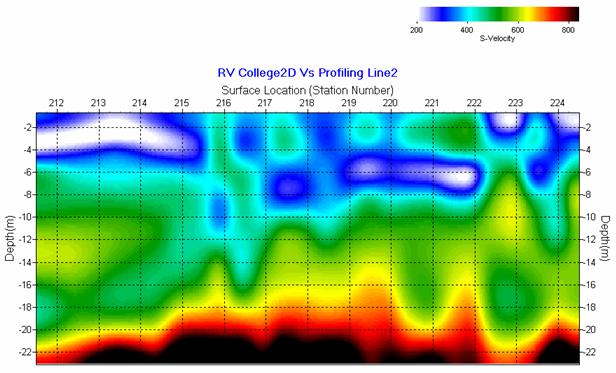
2-D MASW test has been carried out at 20 locations with minimum length of 12m. The 2-D velocity profile has been used to find the layer thickness, subsurface layering information and rock dipping directions. 2-D velocity profiling has been carried out to find the spatial variations and subsurface anomaly. There is no considerable ground layering anomaly present in the subsurface and few locations where filled up soil are found (earlier tank beds which are encroached for habitation). However these filled up soil locations having loosely packed soil with bigger stones results in the lower velocity (less than 200m/s) patches in the 2-D velocity profiles. While drilling, presence of boulders in soil does not allow penetration of SPT sampler tube. The 2-D shear wave velocity profile shows that up to 6.0m to 8.0m, shear wave velocity distribution is irregular due to layering and heterogeneity. This may be resulting due to the presence of filled up soil with boulders. From the depth of 6m/8m to 15m/18m shear wave velocity varies from 300m/s to 500m/s, which corresponds to soft weathered rock as identified in borehole. For a depth of 15m/18m to 20m velocity varies from 500m/s to 700m/s and this can be classified as hard weathered rock (this matches well with the drilled borehole data). In the borelog from 18m depth, hard rock has been identified while drilling. Shear wave velocity of more than 700m/s is also found in the 2-D velocity profiles at that depth.
A power fit regression equation has been developed using 162 pair of shear wave velocity and corrected SPT N values with a regression coefficient of 0.84. The upper and lower bound values of shear wave velocities and corresponding regression equations are presented. The obtained correlation is one of first measured relation for Peninsular India soil. The shear wave velocity versus corrected N value relation can be effectively used to find out the shear modulus for ground shaking response studies.