Department of Civil Engineering,Indian Institute of Science, Bangalore
Local site effects and site response
Site amplification of seismic energy due to soil conditions and the resulting damage to built environment was amply demonstrated by past earthquakes. As seismic waves travel from bedrock to the surface, certain characteristics of the waves, such as amplitude and frequency content is changed as they pass through the soil deposits. This process can transfer large accelerations to structures causing large destruction, particularly when the resulting seismic wave frequency matches with the resonant frequencies of the structures. Site specific ground response analysis aims at determining this effect of local soil conditions on amplification of seismic waves and hence estimating the ground response spectra for future design purposes. The response of a soil deposit is dependent upon the frequency of the base motion and the geometry and material properties of the soil layer above the bedrock. Although not known as seismically very active, Bangalore, a fast growing urban center, with low to moderate earthquake history (Sitharam and Anbazhagan ,2007) and highly altered soil structure (due to large reclamation of land) is been the focus of many of our recent studies.
From the wave propagation theory, it is clear that the ground motion amplitude depends on the density and shear wave velocity of subsurface material (Bullen, 1965; Aki and Richards, 1980). Usually insitu density has relatively smaller variation with depth and thus the shear wave velocity is the logical choice for representing site conditions. An attempt has been made to study the site response of study area using measured shear wave velocity obtained from MASW test.
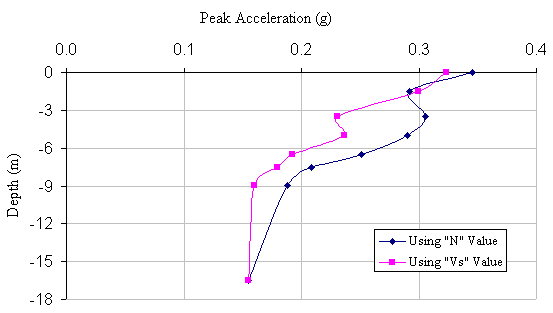
The peak horizontal acceleration at ground surface obtained using shear wave velocity ranges from 0.188g to 0.475g. This is comparable to peak horizontal acceleration values obtained using SPT data. The ground acceleration is considerably large in the areas of tank beds, resulting from the thick layers of silty sand with clay mixture. The shape of variation of peak acceleration with depth is similar to the SPT data. Typical PGA versus depth curve is shown in Figure. Peak acceleration using SPT data is higher when compared to the MASW data and also these variations are large for shallow overburden (with in 12m) thickness. The amplification factor thus calculated using MASW data ranges from 1 to 3.5 which are comparable with the values calculated using SPT data. The dense sand soil, where average shear wave velocity is more than 350m/s, has less amplification. Spectral values at different frequency using MASW data do not vary much from the values obtained using SPT data. The shape of the amplification spectrum obtained using both data matches well, however values of amplification ratio from MASW data is lower than the SPT data. Typical plot amplification ratio versus frequency shows that both data gives same amplification ratio with different frequency. SPT data gives 5.5 Hz and MASW data gives 4Hz corresponding to peak amplification ratio. Also amplification spectrum from both data shows the double peak but at different frequency.
In 1960s in the study area there were over 150 lakes, though most of them are dried up due to erosion and encroachments leaving only 64 at present in an area of 220 sq km. Bangalore city, a fast growing urban center, with low to moderate earthquake history and highly altered soil structure (due to large reclamation of land) needs a detailed study to assess the local site effects for an earthquake. In the present study, an attempt has been made to assess the site response using geotechnical, geophysical data and field experiments. The subsurface profiles of the study area within 220sq.km area was represented by 170 geotechnical bore logs and 58 shear wave velocity profiles obtained by MASW survey. These soil properties and synthetic ground motions for each borehole locations are further used to study the local site effects by conducting one-dimensional ground response analysis using the program SHAKE2000. The response and amplification spectrum have been evaluated for each location. The natural period of the soil column, peak spectral acceleration, spectral acceleration at different frequencies and frequency at peak spectral acceleration of each location (using borehole data as well as MASW data) has been evaluated and presented as maps. Predominant frequency obtained using SPT data and MASW data are compared. Predominant frequency obtained from ground response studies and microtremor measurement is also compared.
Site response analysis based on SPT data
In this study the input rock motions at bed rock were generated for each borehole location based the hypocentral distance calculated for each borehole to the Mandya-Channapatna-Bangalore lineament and used as input for the corresponding borehole to study the site response. Out of 850 borelogs 170 borelogs were carefully evaluated, for the engineering bed rock depth in each borelog from the rock characterization tests, and selected for the site response study. Engineering bed rock is the bed rock having the shear wave velocity of around 700m/sec. The shear modulus is evaluated based on the equation developed by Imai and Tonouchi (1982) using corrected SPT N values. The rock motion obtained from synthetic ground motion model is assigned at the bedrock level as input in SHAKE and evaluated peak acceleration values and acceleration time histories at the top of each sub layer. Response spectra at the top of the bedrock and at ground surface and amplification spectrum between the first and last layer at a frequency step of 0.125 are obtained. Similarly, stress-strain time history and Fourier amplitude spectrum have been obtained for all the borehole locations. These are compiled and presented in the form of maps depicting variation of different parameters. The peak horizontal acceleration (PGA) values at bedrock level are amplified based on the soil profile at various locations. The peak acceleration value at the ground surface obtained from SHAKE2000 is used to prepare the PGA map of Bangalore. They are not distributed uniformly due to variation in the soil profile at various locations.
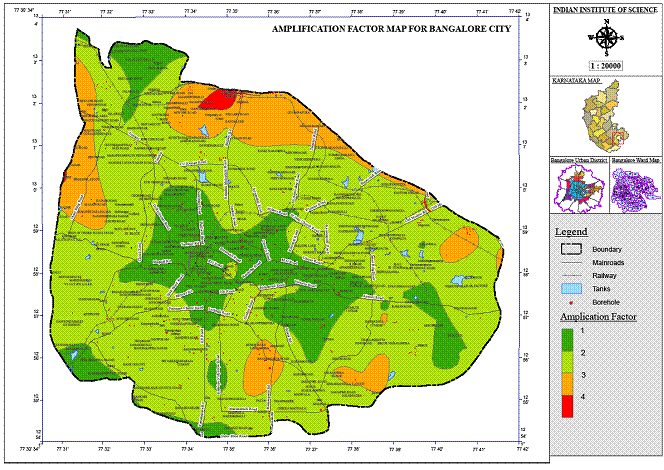
The term Amplification Factor is used here to refer to the ratio of the peak horizontal acceleration at the ground surface to the peak horizontal acceleration at the bedrock. This factor is evaluated for all the boreholes using the PGA at bedrock obtained from the synthetic acceleration time history for each borehole and the peak ground surface acceleration obtained as a result of ground response analysis using SHAKE 2000. The amplification factor thus calculated ranged from 1 to 4.8. The amplification factors are obtained are used to prepare the amplification map of Bangalore. Bangalore city can be divided into four zones based on the range of amplification factors assigned to each zone. The amplification factor map for Bangalore city is shown in Figure.

Site response analysis using shear wave velocity
From the wave propagation theory, it is clear that the ground motion amplitude depends on the density and shear wave velocity of subsurface material (Bullen, 1965; Aki and Richards, 1980). Usually insitu density has relatively smaller variation with depth and thus the shear wave velocity is the logical choice for representing site conditions. An attempt has been made to study the site response of study area using measured shear wave velocity obtained from MASW test.
The peak horizontal acceleration at ground surface obtained using shear wave velocity ranges from 0.188g to 0.475g. This is comparable to peak horizontal acceleration values obtained using SPT data. The ground acceleration is considerably large in the areas of tank beds, resulting from the thick layers of silty sand with clay mixture. The shape of variation of peak acceleration with depth is similar to the SPT data. Typical PGA versus depth curve is shown in Figure. Peak acceleration using SPT data is higher when compared to the MASW data and also these variations are large for shallow overburden (with in 12m) thickness. The amplification factor thus calculated using MASW data ranges from 1 to 3.5 which are comparable with the values calculated using SPT data. The dense sand soil, where average shear wave velocity is more than 350m/s, has less amplification. Spectral values at different frequency using MASW data do not vary much from the values obtained using SPT data. The shape of the amplification spectrum obtained using both data matches well, however values of amplification ratio from MASW data is lower than the SPT data. Typical plot amplification ratio versus frequency shows that both data gives same amplification ratio with different frequency. SPT data gives 5.5 Hz and MASW data gives 4Hz corresponding to peak amplification ratio. Also amplification spectrum from both data shows the double peak but at different frequency.

Comparison of predominant frequency
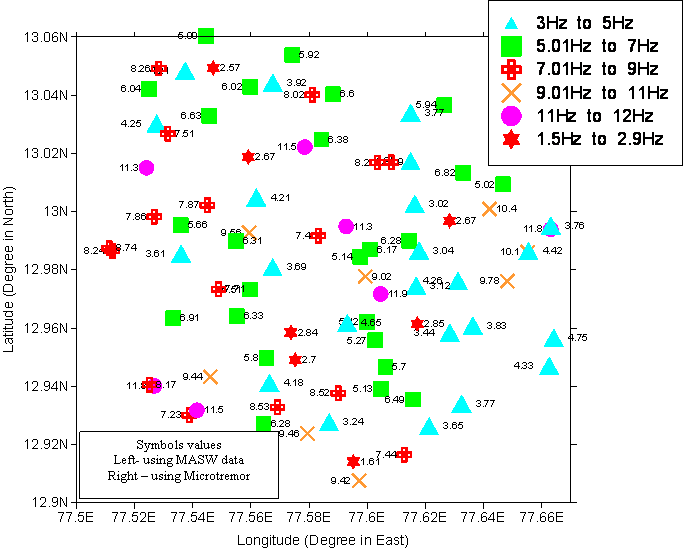
The microtremor survey carried out at 60 locations jointly by National geophysical research Institute (NGRI) Hyderabad and our self for this project to compare predominant periods of the soil columns. The instruments used in this experiment are L4-3D short period sensors equipped with digital acquisition system. The duration of recording was for a minimum of 3 hours and a maximum of 26 hrs. In estimating the site response, Nakamura technique has been widely used and the resonance frequency is obtained by evaluating the horizontal to vertical spectral ratios (Nakamura, 1989).The spectra and the H/V ratios have been computed using the JSESAME program. Site response studies using SPT and MASW data shows that the predominate frequency of Bangalore soil varies from 5Hz to 12Hz. But microtremor studies show that the predominant frequency of Bangalore soil varies from 1.5Hz to 12Hz. Hence a comparative study has been carried out using microtremor results and theoretical studies based on SPT and MASW data. At about 43 locations both microtremor and MASW tests are comparatively closer to each other, and these results are used to compare results. The predominant frequency estimated from Microtremor and estimated form site response using MASW are shown in Figure. In Figure the values reported above the symbol are obtained using MASW based site response study and values reported below the symbols are obtained using microtremor experiments. Figure clearly shows that at most of the locations predominant frequency from both the method matches very well. Most of the study area, predominant frequency is ranging from 3 Hz to 12 Hz except at 7 locations based on microtremor studies. The lower predominant frequency may be attributed due to the topographical effects, which is not accounted in theoretical one-dimensional ground response analysis.

To contact
| Phone: | +91-080-22932467 |
| Cell: | +91-9448100410 |
| Fax: | +91-080-23600404 |
| Email: | anbazhagan@iisc.ac.in , anbazhagan2005@gmail.com |