Department of Civil Engineering,Indian Institute of Science, Bangalore
Site characterization
Site characterization is a must for microzonation and site response study. Site Characterization should include an evaluation of subsurface features, sub surface material types, subsurface material properties and buried/hollow structures to determine whether the site is safe against earthquake effects. A geographical information system (GIS) based subsurface model was developed which helps in data management, develop geostatistical functions, 3-dimensional (3-D) visualization of subsurface with geo-processing capability and future scope for web based subsurface mapping tool. The three major outcome are:
Development of digitized map of Bangalore city with layers of information.
Development of GIS database for collating and synthesizing geotechnical data available with different sources.
Development of 3-dimensional view of subsoil strata presenting various geotechnical properties such as location details, physical properties, grain size distribution, Atterberg limits, SPT N values and strength properties for soil and rock along with depth in appropriate format.
The rock level spatial variability of the bed/hard rock with reference to ground surface is vital for many applications in geosciences. In most of the geotechnical investigations, knowledge of hard strata or rock is essential to decide the type of foundation. In the ground response analysis, Peak Ground Acceleration (PGA) and response spectrum for a particular site is evaluated both at the rock depth level and at the ground level considering local site effects. Here, the response of the soil deposit is determined from the motion at the bed rock level. In all these problems, it is essential to evaluate the depth of the hard rock from the ground level. With an objective of predicting the spatial variability of the reduced level of the bed/hard rock in Bangalore, an attempt has been made to develop a model using Artificial Neural Network (ANN). It is also aimed at comparing the performance of the developed model based on ANN for the available data in Bangalore.
Bangalore map forms the base layer for the development of GIS model. The map entities were developed based on two aspects, first, for locating the bore logs to the utmost accuracy on a scale of 1:20000 and secondly for identification of bore logs by the end user. Digitization of the map layers was done in AutoCAD and then imported to Arc view GIS 8.1.
About 850 borelog information has been keyed into the database. Most of the data so far selected for the database is on an average to a depth of 20m below the ground level with an interval of 0.5m. Most investigations for residential and commercial complexes were below 15m. But wherever bedrock has been encountered investigation has been terminated at that depth. The properties keyed into the database at a particular depth are location details, physical properties, grain size distribution, Atterberg limits, and strength properties for soil and rock.
The Standard Penetration Test, commonly known as the SPT, is carried out in a borehole, by driving a standard split spoon sampler using repeated blows of a 63.5kg hammer falling through 762mm. The hammer is operated at the top of the borehole, and is connected to the split spoon sampler by rods. SPT borelog data includes location of wells, SPT test results, ground water level, grain size distribution, Liquid limit, Plastic limit and strength properties for soil and rock.
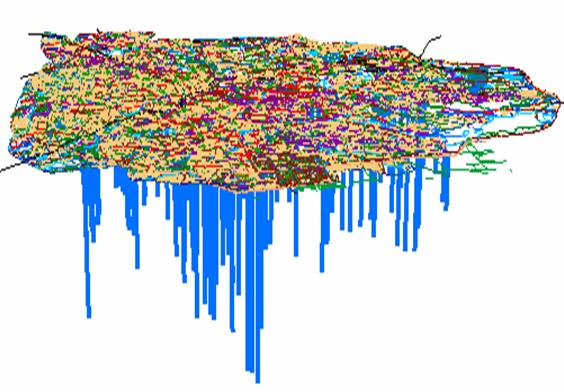
The 3-D subsurface model with geotechnical data has been generated with base map. The boreholes are represented as 3-dimensional objects projecting below the base map layer up to the available borehole depth, geotechnical properties are represented as layers at 0.5m intervals with SPT N values. Each borehole in this model is attached with geotechnical data versus depth. Also scanned image files of borelogs and properties table are attached to the location in plan. The data consists of visual soil classification, standard penetration test results, ground water level, time during which test has been carried out, and, other physical and engineering properties of soil. The model provides two options to view the data at each borehole, 1) visualize the soil character as colored layer with depth information along with properties in excel format and 2) bore logs and properties as an image file. From this 3-D, geotechnical model, geotechnical information on any borehole at any depth can be obtained at every 0.5m interval by clicking at that level (donut).
Figure below shows the view of boreholes below Bangalore city map.
The N values measured in the field using standard penetration test procedure have been corrected for various corrections, such as:(a) Overburden Pressure (CN), (b) Hammer energy (CE), (c) Borehole diameter (CB), (d) presence or absence of liner (CS), (e) Rod length (CR) and (f) fines content (Cfines) (Seed et.al., 1983; 1985; Youd et.al., 2001; Cetin et. al., 2004; and Pearce and Baldwin, 2005).
To contact
| Phone: | +91-080-22932467 |
| Cell: | +91-9448100410 |
| Fax: | +91-080-23600404 |
| Email: | anbazhagan@iisc.ac.in , anbazhagan2005@gmail.com |