Department of Civil Engineering,Indian Institute of Science, Bangalore
Liquefaction Hazard Assessment
Liquefaction can occur in moderate to major earthquakes resulting in severe damages to structures. Transformation of a granular material from solid state to liquid sate due to increased pore pressure and reduced effective stress is defined as liquefaction. When this happens, the sand grains loose its effective shear strength and will behave more like a fluid. The grain size distribution of soil, duration of earthquake, amplitude and frequency of shaking, distance from epicenter, location of water table, cohesion of the soil and permeability of the layer affects liquefaction potential of soil. The liquefaction hazards are commonly associated with saturated sandy and silty soils having low plasticity and density.
The liquefaction potential of soil is estimated from large number of SPT test data in Bangalore. About 620 bore hole information are used for this purpose and the factor of safety against liquefaction is estimated. Based on the factor of safety, the regional liquefaction hazard maps are generated for the estimated peak ground acceleration at the ground surface. Liquefaction hazard map will be very useful to identify vulnerable areas for the future microzonation and seismic risk studies.
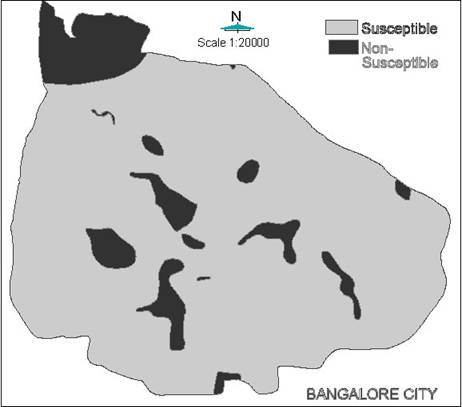
Liquefaction susceptibility is a measure of a soil inherent resistance to liquefaction, and can range from not susceptible, regardless of seismic loading, to highly susceptible, which means that very little seismic energy is required to induce liquefaction. Liquefaction susceptibility was evaluated based on the primary relevant soil properties such as grain size, fine content, and density, degree of saturation, SPT N values and age of the soil deposit in each of the borelogs. Soil is susceptible for liquefaction if presence of sand layers at depths less than 20m, encountered water table depth less than 10m, and SPT field N blow counts less than 20
For evaluating the factor of safety against liquefaction, the earthquake induced loading is expressed in terms of cyclic shear stress and this is compared with the liquefaction resistance of the soil. Liquefaction calculation or estimation requires two variables which are defined based on cyclic stress approaches are:
The seismic demand of a soil layer represented by Cyclic Stress Ratio (CSR).
The capacity of soil to resist liquefaction represented by Cyclic Resistance Ratio (CRR).
If the cyclic stress ratio caused by the earthquake is greater than the cyclic resistance ratio of in situ soil then liquefaction could occur during an earthquake.
Estimation of factor of safety against liquefaction of soil layer requires the ground level peak acceleration due to an earthquake. Ground level peak horizontal accelerations have been estimated by the site response studies using equivalent linear response analysis software (using SHAKE2000 program).About 170 SPT boreholes and 58 MASW tests have been used to study the amplification potential of Bangalore, considering the synthetic ground motions and ground level peak horizontal acceleration map has been generated. This peak ground acceleration is further used to estimate the cyclic stress ratio (CSR).
The excess pore pressure generation to initiate liquefaction depends on the amplitude and the duration of the earthquake induced cyclic loading. In the cyclic stress approach the pore pressure generation is related to the cyclic shear stresses, hence the earthquake loading is represented in terms of cyclic shear stresses.
Liquefaction resistance of soil depends on how close the initial state of soil is to the state corresponding to failure. The liquefaction resistance can be calculated based on laboratory tests and in situ tests. For this study, liquefaction resistance using in situ test based on SPT N values are attempted. Cyclic resistance ratio (CRR) is arrived based on corrected N value.
About 620 borelogs have been selected for factor of safety calculation. The factor of safety for each layer of soil was arrived by considering corresponding corrected SPT N values. The liquefaction hazard map is prepared for the moment magnitude of 5.1. The minimum factor of safety from each bore log has been considered to represent the factor of safety against liquefaction at that location, which are used for the mapping. These factors of safety against liquefaction have been grouped in to 4 groups.
Liquefaction analysis has shown that only 4.2% of the total locations is having a factor of safety less than one whereas about 14.7% has a factor of safety in between 1 and 2. About 12.5% has a value of 2 to 3 and about 68% has a factor of safety value more than 3. About 33% of the locations has silty clay soil which may cause stress reduction in soil during earthquake as they are having liquid limit more than 33 and plasticity index greater than 12. It is also found that areas close to water body and streams have the factor of safety less than unity. The borelog of locations having factor of safety less than one clearly indicates that up to a depth of about 6 m very loose silty sand with clay and sand is present which are classified as medium to fine sand having very low field N values. Also in these locations shallow water table has been met, at about 1.2m from the ground level. These factors may attribute to the low factor of safety.
Cyclic Triaxial Experiments on Undisturbed Soil Samples
Undisturbed samples were collected from few locations in (south west region) Bangalore city to verify the liquefaction potential of the soil. Cyclic triaxial tests have been carried out in the laboratory on the undisturbed soil samples collected from Boreholes locations of 482, 810 and 91. The tests have been carried out as per ASTM: D 3999 (1991) in strain controlled mode. Cyclic triaxial tests are carried out with double amplitude axial strains of 0.5%, 1% and 2% with a frequency of 1Hz. Typical cyclic triaxial test results are presented in Figures 9.9 and 9.10. Figure 9.9 shows the variation of deviatoric stress versus strain plot for more than 120 cycles of loading (axial strain = 0.25%; applied confining pressure 100 KPa, for the undisturbed sample corresponding to a depth 3m below GL, in-situ density of the soil sample 2.0 gm/cc with in-situ moisture content 15%, at 3.0m depth). Figure 9.10 shows the pore pressure ratio versus number of cycles. From these plots it is clear that even after 120 cycles, the average pore pressure ratio is about 0.94 and deviatoric stresses vs. strain plots have not become flat, indicating no liquefaction. The resistance to liquefaction of these soils is very high. The calculated factor of safety against liquefaction results for this borehole is also very high indicating no liquefaction and results matches well with the lab test results.